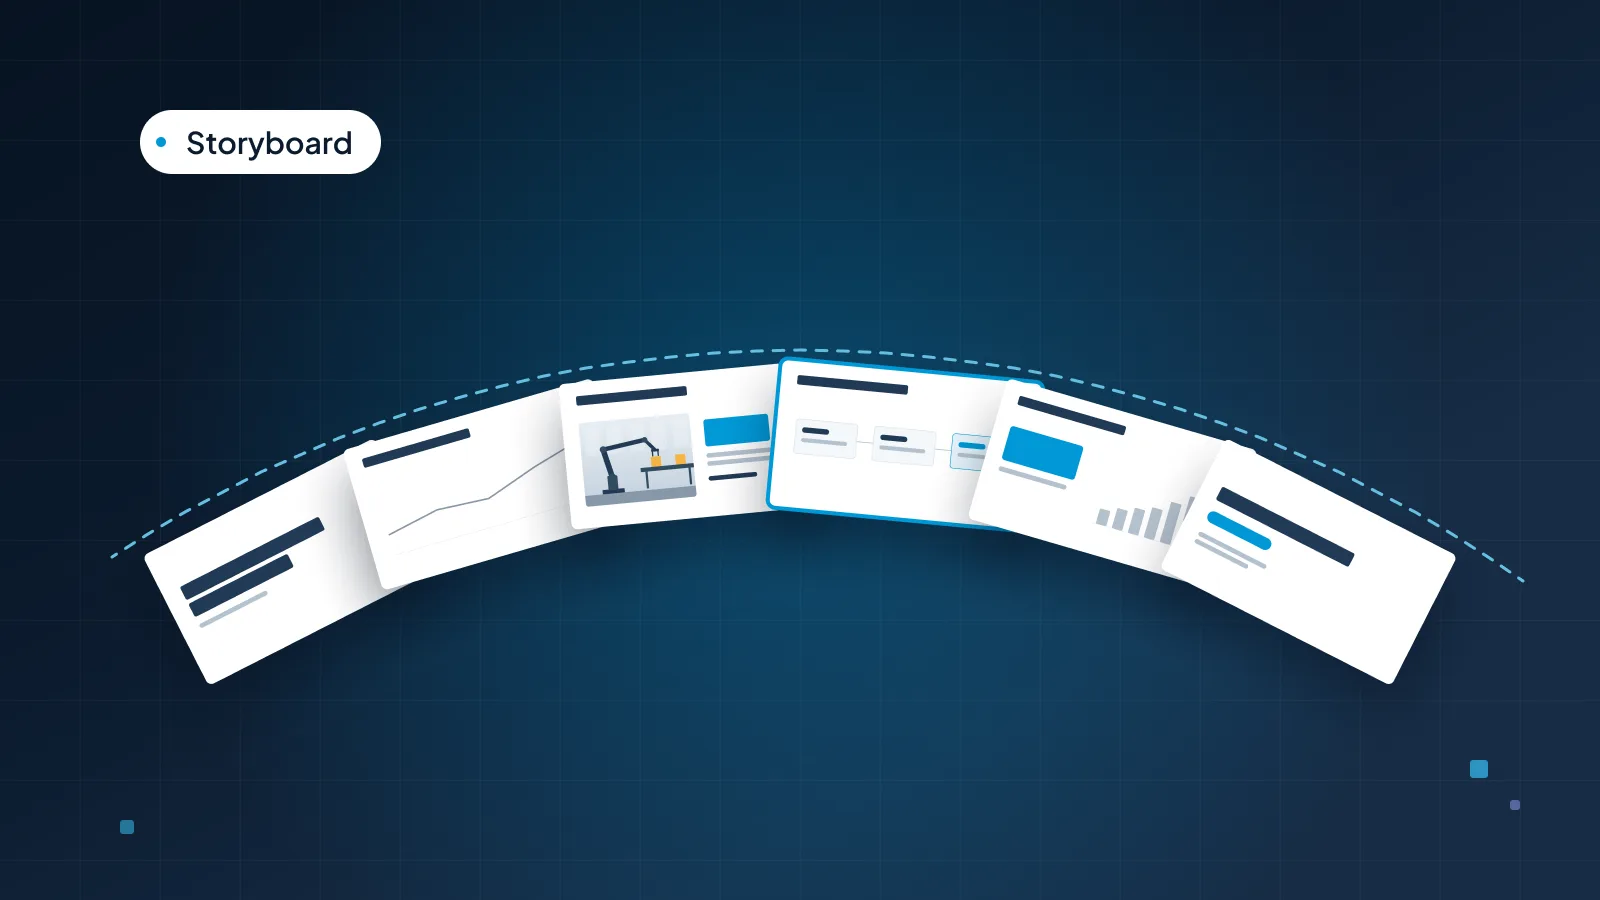
Management consultants are known for a particular kind of slide: a full-sentence title, a chart that proves it, a small source line and a lot of backup in the appendix. People sometimes copy the look (navy, small type, dense charts) and miss the part that matters, which is how the deck is structured.
This guide explains those habits plainly, so any team can use them in a strategy deck, a leadership review or a board paper. It covers what makes a slide "consulting style", how to write the storyline first, action titles and the "so what" test, one message per slide, sources and trackers, the appendix, and when the style is too much. The running example is Calder Robotics, a fictional company that makes robotic picking and assembly cells, asking its leadership team to fund a new customer onboarding program in Europe.
What makes a slide "consulting style"
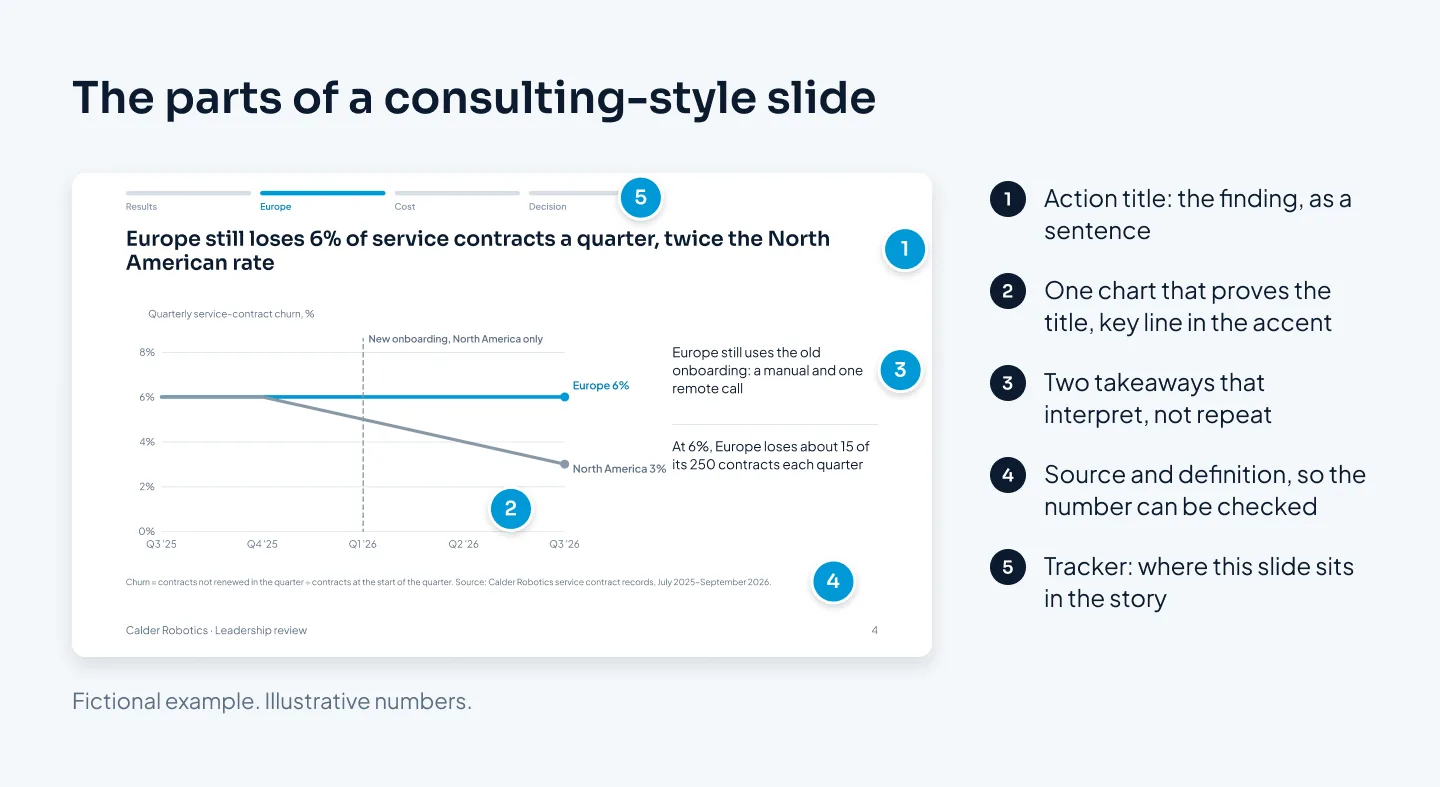
Strip away the colors and the fonts, and a consulting-style deck comes down to six habits:
The storyline is written first, as a list of slide titles, before anyone builds a slide.
Every title is an action title: a full sentence that states the slide's finding.
Each slide carries one message, with the evidence for it underneath.
Every number has a source line, so a reader can check it.
A tracker shows where each slide sits in the argument.
Detail goes to backup slides in an appendix, ready for questions.
Together they let a deck be read two ways. Read across, the titles alone tell the whole story, from the recommendation to the decision. Read down, each slide's body proves its own title. A busy executive can skim the titles in a minute; a skeptical one can check any slide and find the evidence.
None of this is a secret method. It's a way of writing an argument that many business writers use, and our guide to storytelling in presentations covers several of the frameworks behind it.
Write the storyline first
The most useful habit is also the least visible: the storyline is written before any slide is designed. You write the slide titles as a list of sentences, in order, and you don't open PowerPoint until the list makes the case on its own.
Writing titles first is cheaper than writing slides first. Moving a sentence takes a second. Moving a finished slide, with its chart and its formatting, takes much longer, so people tend not to, and a weak order survives.
A structure that suits most business decks is situation, complication, resolution, which is widely used in consulting and business writing. Lead with the answer, then lay out the story behind it:
The answer. What you recommend, in one sentence. For Calder Robotics: roll the new onboarding program out to Europe from January.
The situation. What's true and agreed. Calder fixed its onboarding in North America at the start of 2026, and churn on its service contracts there fell.
The complication. What's wrong, or what's changed. Europe still uses the old onboarding, and still loses service contracts at the old rate.
The resolution. What to do, what it costs and what you need. Four trainers for Europe, the cost against the revenue they keep, and the decision.
Then check the supporting points. They should not overlap, and together they should leave no gap a skeptic could drive through. If two titles make the same point, merge them. If someone could ask "but what about the cost?" and no title answers it, you're missing a slide.
Action titles that pass the "so what" test
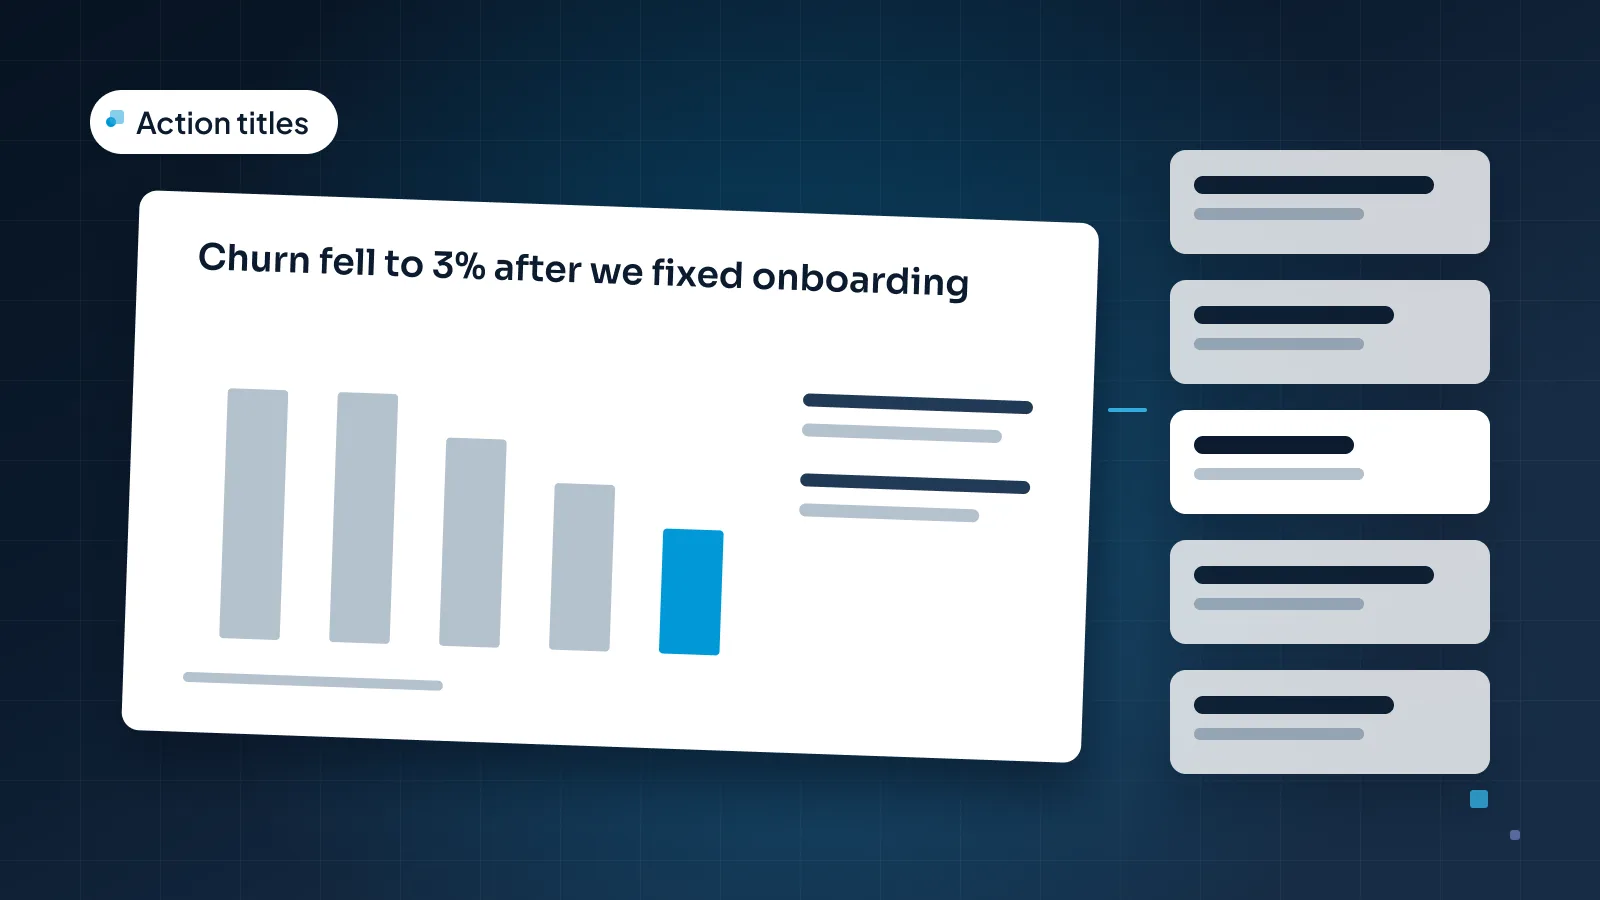
An action title is a slide title written as the slide's finding, in a full sentence. "Customer churn" is a topic. "North American churn fell to 3% after we fixed onboarding" is an action title.
The "so what" test is how you get from one to the other. Read the title and ask "so what?" If the question still makes sense, the title isn't finished. Here's Calder's churn slide, rewritten until the question stops working:
"Customer churn." So what?
"Churn by quarter, 2025–2026." So what?
"Churn has changed in North America." So what?
"North American churn fell to 3% after we fixed onboarding." Now the reader knows the finding, and why it matters to the decision.
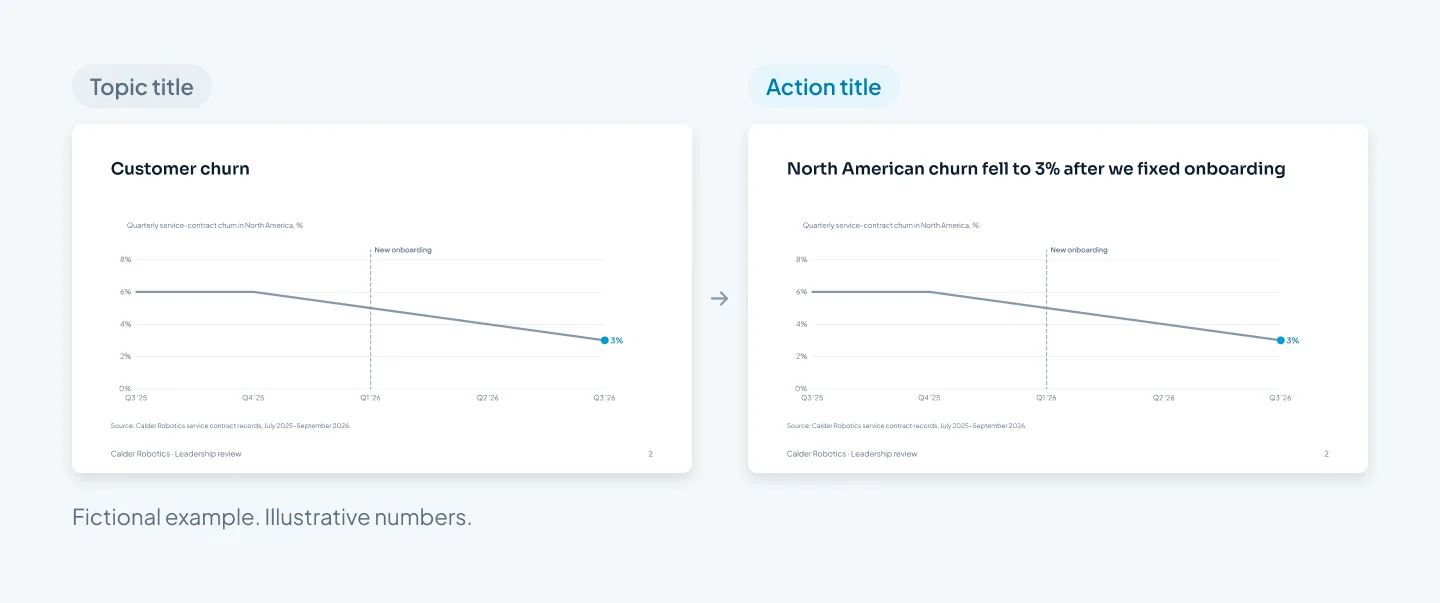
The chart is identical in both versions. Only the title changed, and with it, what the reader takes from the slide before they look at a single data point.
A few rules for writing them:
A full sentence, with a fact in it: a number, a comparison or a direction.
Two lines at most, ideally under 15 words. Longer titles start doing the body's job.
One point per title. If you need "and" to join two findings, you probably need two slides.
Claim only what the slide proves. "After we fixed onboarding" states timing. "Because we fixed onboarding" claims cause, and you should only write it if the body shows why, for example by comparing against a region that didn't change. Calder's deck makes that comparison on the next slides, with Europe.
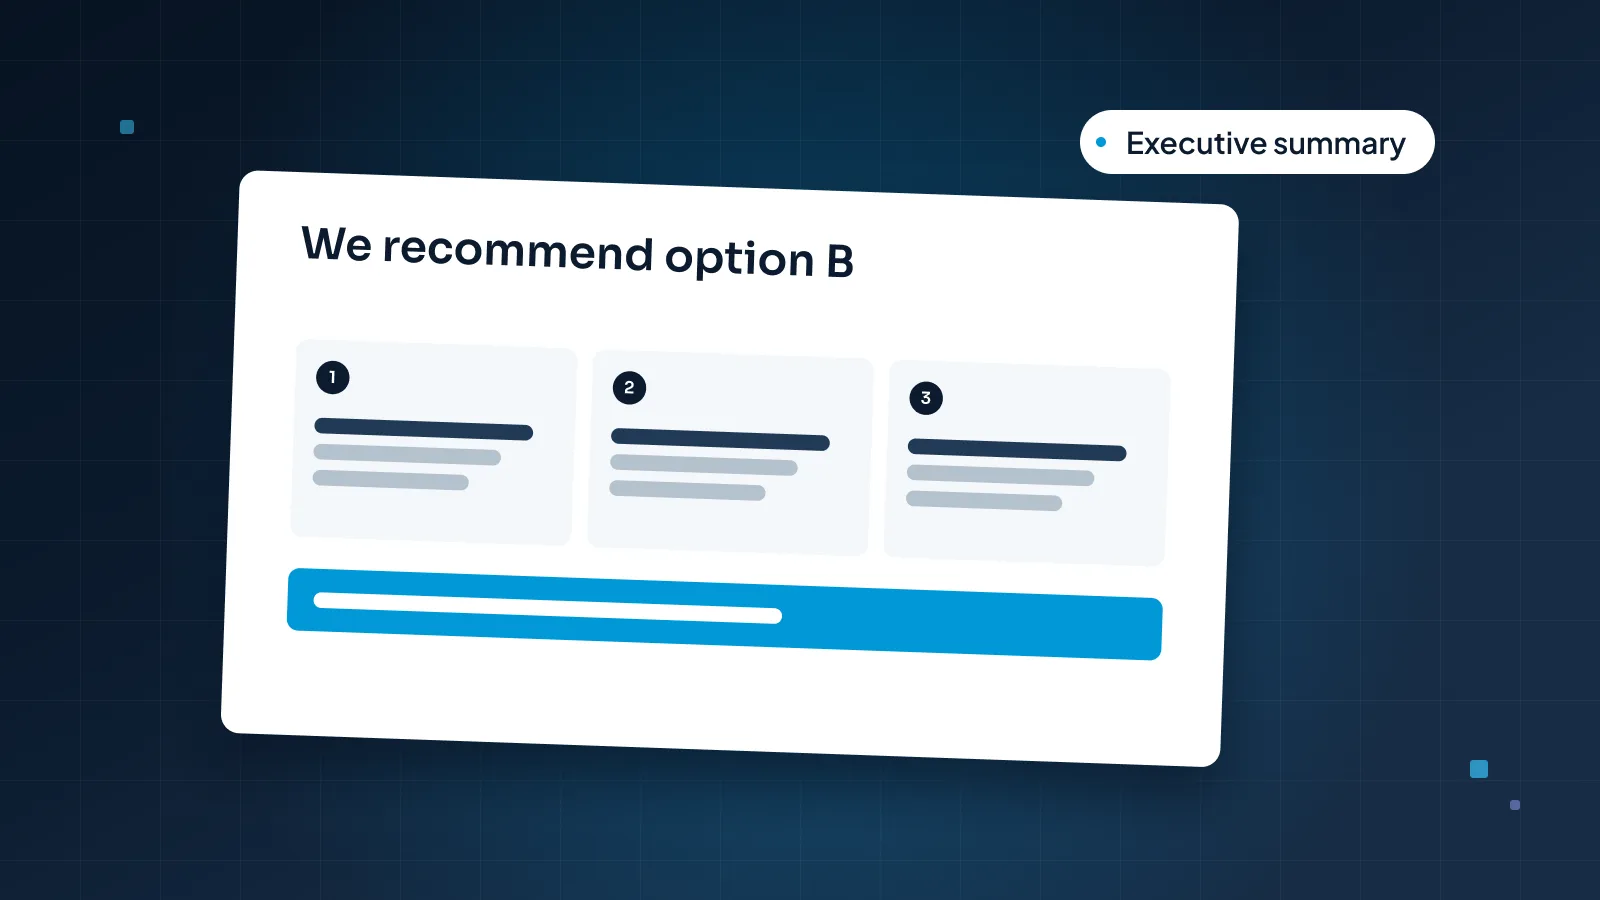
That last rule matters more than it looks. Action titles are persuasive, which is exactly why a title that overstates the evidence does more damage than a vague one. Our guide to presenting to executives shows how the same titles carry an executive summary.
One message, with the evidence under it
Once the title states the finding, the body has one job: prove it. That's the "read down" half of the deck.
Here is the whole Calder storyline, titles only. Read them in order and you have the argument; each title then needs a slide that proves it.
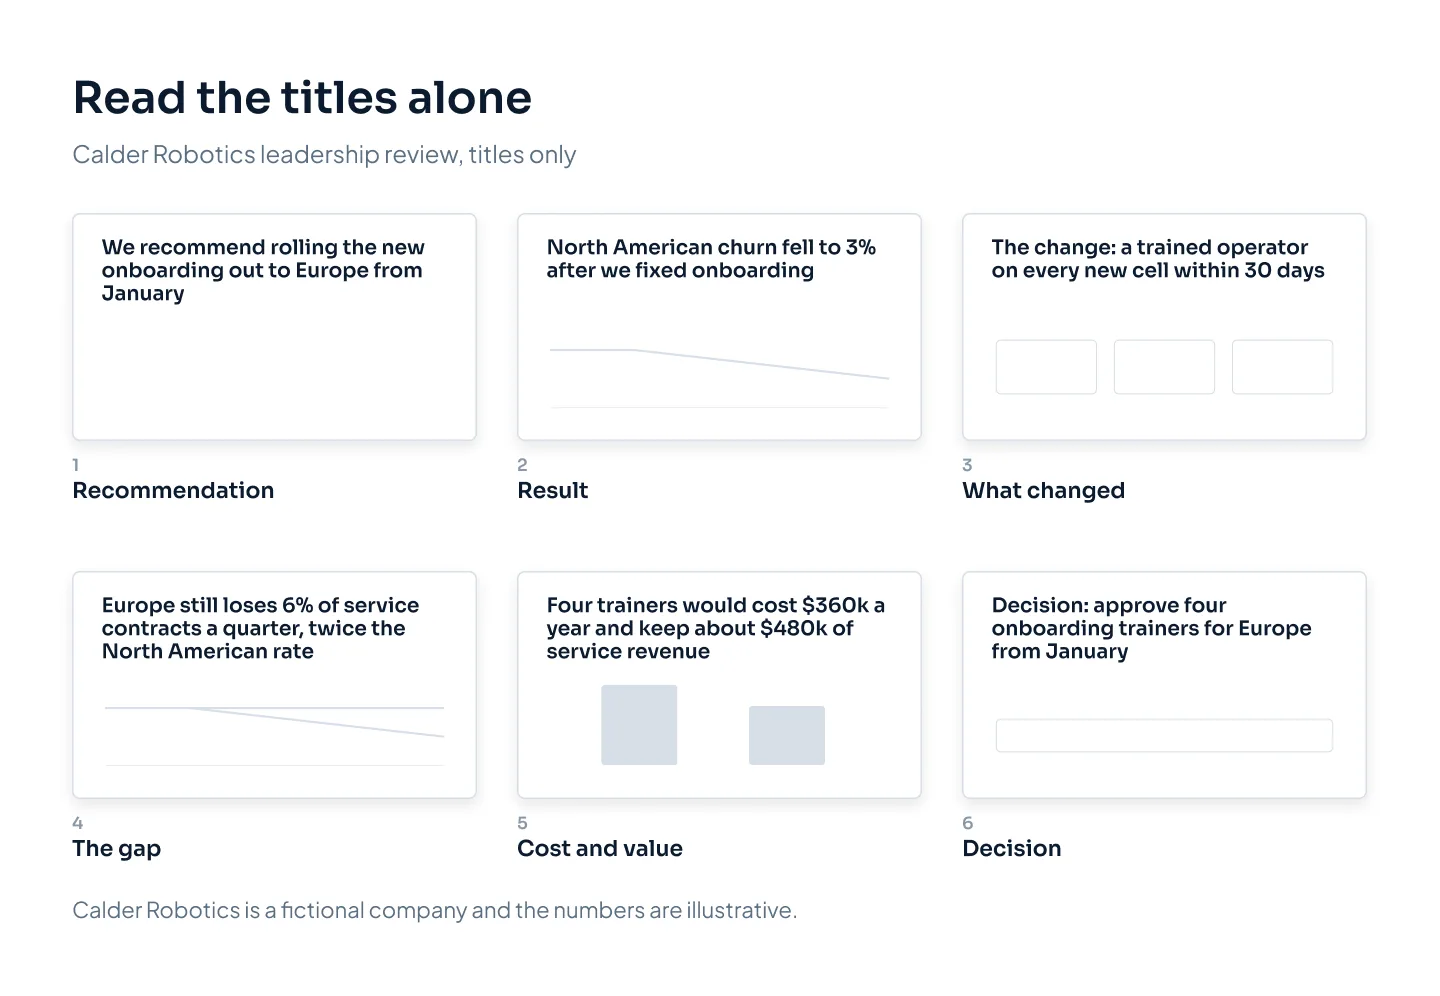
We recommend rolling the new onboarding out to Europe from January
North American churn fell to 3% after we fixed onboarding
The change: a trained operator on every new cell within 30 days
Europe still loses 6% of service contracts a quarter, twice the North American rate
Four trainers would cost $360k a year and keep about $480k of service revenue
Decision: approve four onboarding trainers for Europe from January
For each slide, the evidence follows a simple pattern:
One piece of evidence. Usually one chart or one small table. Two charts on one slide often means two messages.
Highlight the part that proves the title. On slide 4, the Europe line is in the accent color and North America is gray. The reader's eye goes straight to the gap.
Two or three takeaways that interpret, not repeat. "Europe still uses the old onboarding: a manual and one remote call" adds something the chart can't show. "Europe's churn is 6%" just reads the chart aloud.
Everything else goes. If a data point doesn't support the title, it moves to the appendix or to a slide of its own.
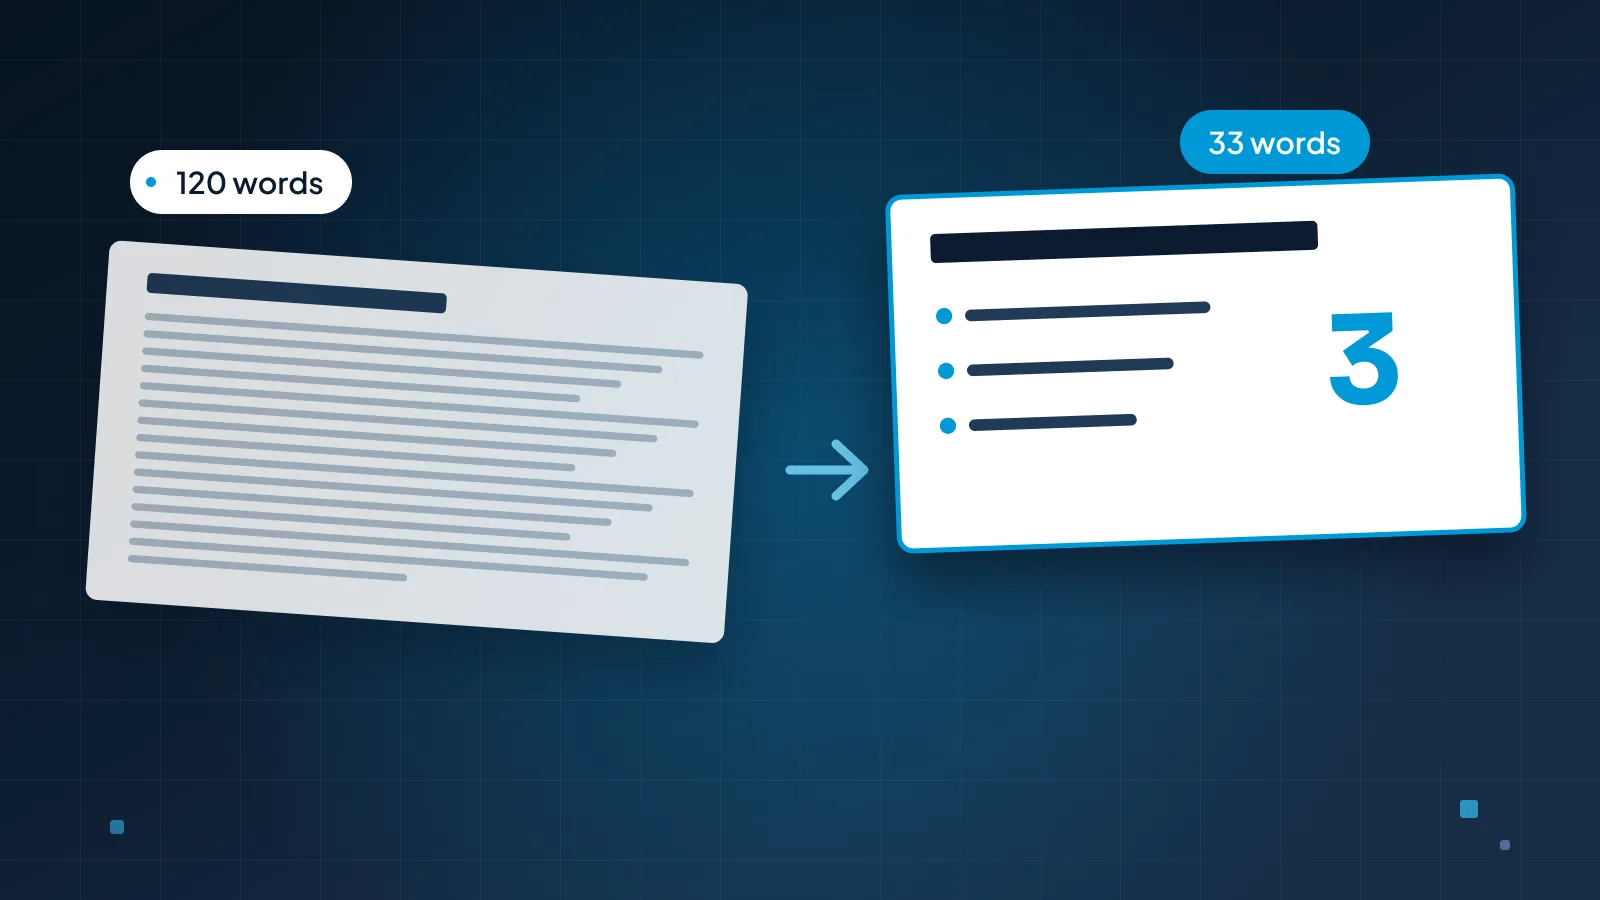
Consulting slides are often dense, but dense isn't the same as cluttered. A dense slide has a lot of evidence for one point. A cluttered slide has a little evidence for five. If you're fighting the second kind, our guide to cutting text on slides shows how to split and trim it, and our guide to presenting data in PowerPoint covers chart choice and labeling.
A title should say what the slide proves, not what it's about.
Sources, footnotes and trackers
The small print is what makes a consulting deck checkable.
Source lines. Every number gets a short line at the bottom of the slide saying what it is, whose data it is and when it's from: "Source: Calder Robotics service contract records, July 2025–September 2026." Put it in the same place, at the same size, on every slide.
Footnotes for definitions and assumptions. If a metric could be read two ways, define it once: "Churn = service contracts not renewed in the quarter, divided by contracts at the start of the quarter." Forecasts get their assumptions in a footnote too, so nobody has to ask.
Trackers. A tracker is a small bar along the top of the slide listing the sections of the deck, with the current one highlighted. Calder's reads "Results · Europe · Cost · Decision". It helps in long decks, and it helps readers who jump straight to one section of a pre-read. Calder's main deck is only six slides, but it goes out as a pre-read with a backup section, so the tracker helps readers who jump around. On a short deck that's only presented, leave it out.
Build the tracker into the slide master rather than pasting it onto slides. In Slide Master view, insert a layout for each section and rename it (for example, "Content, Europe"), with the tracker drawn on the layout. Items placed on a layout can't be selected or moved by accident in Normal view, so the tracker stays put. Our guide to the PowerPoint slide master covers layouts and placeholders in detail.
Backup slides and the appendix
The appendix is where the rest of your work lives: the cost model, the data cut five other ways, the methodology. It isn't presented. It's there for the moment someone asks.
Build it from the questions you expect:
List the hard questions. For Calder: how was the $480k worked out, did churn fall for every customer size, and why four trainers rather than two?
Give each question one backup slide, with an action title that answers it. Calder's first backup slide shows the math: 250 European contracts at $16,000 a year; halving churn from 6% to 3% a quarter keeps about 30 contracts a year; 30 × $16,000 = $480,000, against four trainers at $90,000 each, or $360,000.
Number them B1, B2 and so on, after a clear Backup divider, and point to them from the main slides: "Cost model: backup B1."
Know where they are. Keep the list of backup slide numbers in your speaker notes, which you can see in Presenter View while the room sees only the slide.
Whether the deck is sent as a pre-read or presented live changes how much stays in the main deck. Our board presentation guide covers building both from one file.
When the style is too much
Consulting-style slides are built for decisions: a leadership team, a board, an investment committee. Used everywhere, the style starts to work against you.
Keynotes and conference talks. A large audience wants a story and one idea at a time, not evidence to check. Keep the action titles, but make them short, and leave the source lines for the handout.
Sales pitches. Buyers care about their problem, not your storyline. Lead with their situation, in their words, and keep the appendix for the procurement team.
Short presented decks. A six-slide talk that nobody will read afterwards doesn't need a tracker, a Backup divider and numbered footnotes.
Presented, not read. A dense slide on a screen makes the room read instead of listen. If you're presenting, move the takeaways into your notes and let the title and the chart do the work.
Three-line titles. If the title needs three lines, the slide probably holds two findings.
Customer reviews sit in between. A quarterly business review benefits from action titles and a clear decision slide, with lighter evidence; our QBR presentation guide shows the balance.
Complex numbers can still be easy to follow. Our Utatu Opus case study is an animated investment proposal for a rooftop solar project in Uganda that makes a financial model easy to follow.
To have the deck designed for you, our corporate presentation design service covers strategy, leadership and board decks. At Pixel Presentation, design is $10 a slide, or $15 for complex slides such as multi-series data charts and process diagrams. A 20-slide deck with five complex slides is $225, and corporate decks take 5–10 working days. The pricing estimator shows your exact price before you order.